QUESTION 1
A random sample of house sizes in major city has a sample mean of x¯=1204.9 sq ft and sample standard deviation of s=124.6 sq ft. Use the Empirical Rule to determine the approximate percentage of house sizes that lie between 955.7 and 1454.1 sq ft.
Round your answer to the nearest whole number (percent).
QUESTION 2
Andrea conducted a survey in which she collected data on the percentage of people who like horror films and the percentage of people who like romantic dramas. Which of the following could sufficiently display the data if only the two given categories are to be included?
QUESTION 3
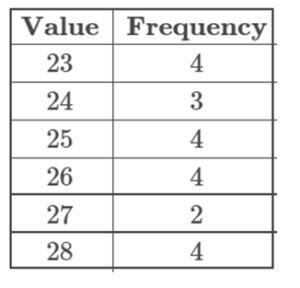
Given the following frequency table of values, is the mean or the median likely to be a better measure of the center of the data set?
QUESTION 4
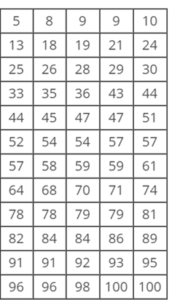
The following dataset represents the number of registered students for 60 college courses, sorted and arranged in rows of 5. What is the 50th percentile of the data?
QUESTION 5
Given that P(B|A)=0.77 and P(A)=0.36, what is P(B AND A)? Round to three decimal places.
QUESTION 6
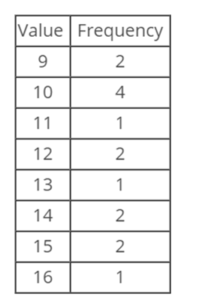
Tanya loves to walk in the park everyday after work. Given the frequency table below for a list of miles walked daily over the past few weeks, find the mean. (Please do not include the units in your answer.)
Which of the following shows independent events?
QUESTION 8
Given the frequency table below, what is the relative frequency of the data value 2?

QUESTION 9
A bowling alley attendant records the number of people that request certain shoe sizes on a particular night. His findings are reported in the following frequency table.
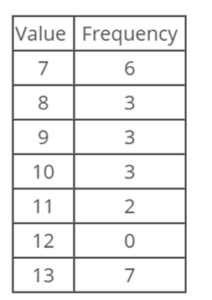
Which histogram accurately summarizes the data?
QUESTION 10
Is the statement below true or false?
Continuous is the type of quantitative data that is the result of measuring
QUESTION 11
When considering different sampling methods, cluster sampling includes the steps
QUESTION 12
Two students, Stephanie and Maria, want to find out who has the higher GPA when compared to each of their schools. Stephanie has a GPA of 3.85, and her school has a mean GPA of 3.1 and a standard deviation of 0.4. Maria has a GPA of 3.8, and her school has a mean of 3.05 and a standard deviation of 0.2. Who has the higher GPA when compared to each of their schools?
QUESTION 13
Timothy wants to estimate the mean number of siblings for each student in his school. He records the number of siblings for each of 75 randomly selected students in the school. What is the statistic?
QUESTION 14
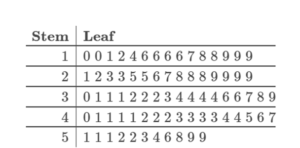
A set of data is summarized by the stem and leaf plot below.
QUESTION 15
Given the following information about events A, B, and C, determine which pairs of events, if any, are independent and which pairs are mutually exclusive.
P(A)P(B)P(C)=0.26=0.5=0.45P(A|B)P(B|C)P(C|A)=0.26=0=0.26
QUESTION 16
A bag contains 9 RED beads, 3 BLUE beads, and 8 GREEN beads. If a single bead is picked at random, what is the probability that the bead is RED or GREEN?
QUESTION 17
Suppose A and B are mutually exclusive events, and that P(A)=0.13 and P(B)=0.85. Find P(A OR B).
QUESTION 18
Given the following list of data, find the median.
19,11,33,24,5,8,16,32,22,17
Give your answer as a number only. For example, if you found the median was 20, you would enter 20.
QUESTION 19
A data set lists the number of times a machine breaks each month in a shoe factory over the past year. For this data set, the minimum is 4, the first quartile is 6, the median is 8, the interquartile range is 3, and the maximum is 20. Construct a box-and-whisker plot that shows the number of times the machine breaks.
QUESTION 20
For the following data set, you are interested to determine the “spread” of the data.
Would you employ calculations for the sample standard deviation, or population standard deviation for this data set:
- You are interested in the heights of students at a particular middle school. Your data set represents the heights of all students in the middle school with 600
Solution:
QUESTION 1
A random sample of house sizes in major city has a sample mean of x¯=1204.9 sq ft and sample standard deviation of s=124.6 sq ft. Use the Empirical Rule to determine the approximate percentage of house sizes that lie between 955.7 and 1454.1 sq ft.
Round your answer to the nearest whole number (percent).
Answer: 95%
QUESTION 2
Andrea conducted a survey in which she collected data on the percentage of people who like horror films and the percentage of people who like romantic dramas. Which of the following could sufficiently display the data if only the two given categories are to be included?
Answer: Bar Graph
…..Click link below to purchase full tutorial at $15