Question
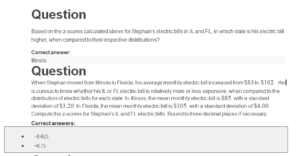
Based on the z-scores calculated above for Stephan’s electric bills in IL and FL, in which state is his electric bill higher, when compared to their respective distributions?
Question
When Stephan moved from Illinois to Florida, his average monthly electric bill increased from $83 to $102. He is curious to know whether his IL or FL electric bill is relatively more or less expensive, when compared to the distribution of electric bills for each state. In Illinois, the mean monthly electric bill is $85, with a standard deviation of $3.20. In Florida, the mean monthly electric bill is $105, with a standard deviation of $4.00.
Compute the z-scores for Stephan’s IL and FL electric bills. Round to three decimal places if necessary.
Question
Which of the following frequency tables show a skewed data set? Select all answers that apply.
Question
Given the following frequency table, decide if the data is skewed or symmetrical.
| Value | Frequency |
| 4 | 1 |
| 5 | 10 |
| 6 | 8 |
| 7 | 28 |
| 8 | 50 |
| 9 | 69 |
| 10 | 72 |
| 11 | 62 |
| 12 | 52 |
| 13 | 23 |
| 14 | 16 |
| 15 | 6 |
| 16 | 3 |
Question
The following data values represent the daily amount spent by a family each day during a 7 day summer vacation.
Find the standard deviation of this data set:
$96,$125,$80,$110,$75,$100,$121
- Round the final answer to one decimal place.
Question
The following data values represent the daily amount spent by a family each day during a 7 day summer vacation.
$96,$125,$80,$110,$75,$100,$121
To determine the “spread” of the data, would you employ calculations for the sample standard deviation, or population standard deviation for this data set?
Question
Salvatore, as the director of a regional bank, is concerned about the wait times of customers at the four branches. He randomly selects 48 patrons at each branch and records the waiting time for each patron. The results of the samples are shown below.
The Alvrine branch has a mean waiting time of 13.49 minutes with a standard deviation of 1.97 minutes.
The Durham branch has a mean waiting time of 12.61 minutes with a standard deviation of 2.89 minutes.
The Hanover branch has a mean waiting time of 11.06 minutes with a standard deviation of 2.46 minutes.
The Mascomonet branch has a mean waiting time of 12.89 minutes with a standard deviation of 3.12 minutes.
Which of the branches has the most inconsistent waiting times? Explain.
Question
Suppose there is an estate sale featuring many items sold at different prices. The mean selling price of the items is 75 dollars, and the standard deviation is 20. A piece of costume jewelry is priced at 15 dollars.
Which of the following statements is true?
Question
Which of the following box-and-whisker plots shows a skewed data set? Select all answers that apply.
Question
A large company is interested to know the variation in yearly sales for its salespeople. The data set shown below is the yearly sales for 5 randomly selected salespeople (expressed in thousands of dollars):
40,60,65,70,80
Find the standard deviation for this data set.
- Round the final answer to the nearest tenth if necessary.
Question
A large company is interested to know the variation in yearly sales for its salespeople. The data set shown below is the yearly sales for 5 randomly selected salespeople (expressed in thousands of dollars):
40,60,65,70,80
Find the variance for this data set.
- Round the final answer to the nearest tenth if necessary.
Question
A large company is interested to know the variation in yearly sales for its salespeople. The data set shown below is the yearly sales for 5 randomly selected salespeople (expressed in thousands of dollars):
40,60,65,70,80
To determine the “spread” of the data, would you employ calculations for the sample standard deviation, or population standard deviation for this data set?
Question
A food processing plant fills snack-sized bags of crackers. The mean number of crackers in each bag is 22 and the standard deviation is 2. The factory supervisor selects one bag that contains 24 crackers.
Which of the following statements is true?
Question
Which of the data sets represented by the following histograms has the smallest standard deviation
Question
Based on the z scores found above, is Kathy or Linda’s starting salary higher, when compared to the salary distributions of each company?
Question
Kathy and Linda both accepted new jobs at different companies. Kathy’s starting salary is $31,500 and Linda’s starting salary is $33,000. They are curious to know who has the better starting salary, when compared to the salary distributions of their new employers.
A website that collects salary information from a sample of employees for a number of major employers reports that Kathy’s company offers a mean salary of $42,000 with a standard deviation of $7,000. Linda’s company offers a mean salary of $45,000 with a standard deviation of $6,000.
Find the z-scores corresponding to each woman’s starting salary.
Question
If the mean of a data set is 20 and the median is 25, which of the following is most likely?
Solution:

Click link below to purchase full tutorial at $5