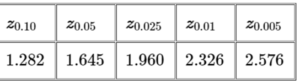
Question
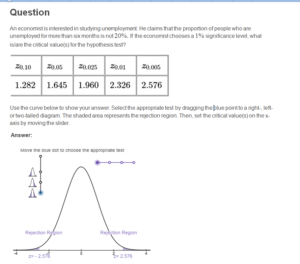
An economist is interested in studying unemployment. He claims that the proportion of people who are unemployed for more than six months is not 20%. If the economist chooses a 1% significance level, what is/are the critical value(s) for the hypothesis test?
Use the curve below to show your answer. Select the appropriate test by dragging the blue point to a right-, left- or two-tailed diagram. The shaded area represents the rejection region. Then, set the critical value(s) on the x-axis by moving the slider.

Question
A psychologist is interested in studying the sleeping patterns of individuals diagnosed with depression. She claims that the proportion of depressed patients who sleep 8 hours per night is less than 75%. If the psychologist chooses a 0.5% significance level, what is/are the critical value(s) for the hypothesis test?
Use the curve below to show your answer. Select the appropriate test by dragging the blue point to a right-, left- or two-tailed diagram. The shaded area represents the rejection region. Then, set the critical value(s) on the x-axis by moving the slider.
Question
Based the results from the school psychologist’s investigation of the proportion of questions that are related to cultural sensitivity on the aptitude test, choose the correct conclusion that interprets the results within the context of the hypothesis test.

Question
An aspiring venture capitalist is interested in studying early-stage companies. She claims that the proportion of new businesses that earn a profit within the first two years of operation is more than 18%. If the venture capitalist chooses a 10% significance level, what is/are the critical value(s) for the hypothesis test?
Use the curve below to show your answer. Select the appropriate test by dragging the blue point to a right-, left- or two-tailed diagram. The shaded area represents the rejection region. Then, set the critical value(s) on the x-axis by moving the slider.
Answer:
Question
A police officer claims that the proportion of drivers wearing seat belts is more than 55%. To test this claim, a random sample of drivers are checked for seat belt usage.
Assume that the test statistic for this hypothesis test is 1.87.
Assume the critical value for this hypothesis test is 1.645.
Come to a decision for the hypothesis test and interpret your results with respect to the original claim.
Solution:
Click link below to purchase full tutorial at $5