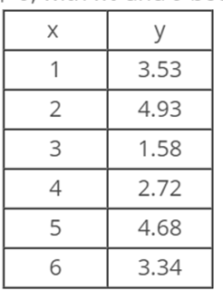
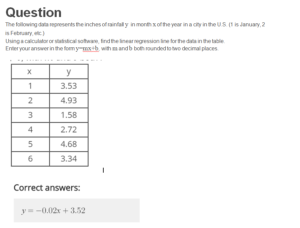
Question
The following data represents the inches of rainfall y in month x of the year in a city in the U.S. (1 is January, 2 is February, etc.)
Using a calculator or statistical software, find the linear regression line for the data in the table.
Enter your answer in the form y=mx+b, with m and b both rounded to two decimal places.
Question
Using a calculator or statistical software, find the linear regression line for the data in the table below.
Enter your answer in the form y=mx+b, with m and b both rounded to two decimal places.
Question
Using the linear relationship graphed above, estimate the percent of return customers if 80% of customers wait more than 10 minutes in line.
Question
A grocery store manager explored the relationship between the percent of customers that wait more than 10 minutes in line and the percent of return customers at the store. The manager collects information from 6 checkout lines, shown in the table below.
Use the graph below to plot the points and develop a linear relationship between the percent of waiting customers and the percent of return customers.
Question
How much water should be consumed every two hours for a person to run 16 miles?
- Round your final answer to the nearest whole number.
Question
A runner finds that the distance they run in miles, D, is dependent on the ounces of water consumed every two hours, x, and can be modeled by the function
D(x)=1.5x.
Draw the graph of the distance function by plotting its D-intercept and another point.
Answer:
Question
Using the linear relationship graphed above, estimate the percent of snack purchases if 80% of customers wait in line for more than 15 minutes.
Question
A ticket taker at a movie theater explored the relationship between the percent of customers that wait more than 15 minutes in line for tickets and the percent of customers that purchase snacks at the theater. The ticket ticker collects information from 6 lines during a particular week, shown in the table below.
Use the graph below to plot the points and develop a linear relationship between the percent of waiting customers and the percent of snack purchases at a movie theater.
Answer:
Question
How much time did a person spend at the library over a month for them to spend 40 hours reading a book?
- Round your final answer to the nearest whole number.
Question
A librarian finds that the number of hours spent reading a book over a month, R, is dependent on the numbers of hours a person spends at the library over the course of a month, x, and can be modeled by the function
R(x)=26+1.5x.
Draw the graph of the reading function by plotting its R-intercept and another point.
Answer:
Question
The scatter plot below shows data relating total income and the number of children a family has. Which of the following patterns does the scatter plot show?
Question
Using a calculator or statistical software, find the linear regression line for the data in the table below.
Enter your answer in the form y=mx+b, with m and b both rounded to two decimal places.
| x | y |
| 0 | 3.16 |
| 1 | 4.72 |
| 2 | 4.5 |
| 3 | 6.6 |
| 4 | 7.72 |
| 5 | 7.39 |
| 6 | 11.11 |
| 7 | 10.57 |
| 8 | 11.06 |
Question
Using a calculator or statistical software, find the linear regression line for the data in the table below.
Enter your answer in the form y=mx+b, with m and b both rounded to two decimal places.
| x | y |
| 2 | 9.58 |
| 3 | 7.46 |
| 4 | 9.28 |
| 5 | 11.58 |
| 6 | 14.94 |
| 7 | 14.97 |
| 8 | 18.43 |
| 9 | 18.04 |
| 10 | 20.42 |
Question
Rosetta owns a wedding photography business. For each wedding, she charges $100 plus $50 per hour of work. A linear equation that expresses the total amount of money Rosetta earns per wedding is y=50x+100. What are the independent and dependent variables? What is the y-intercept and the slope?
Solution:
…..Click link below to purchase full tutorial at $10