QUESTION 1
If A and B are events with P(A)=0.2, P(A OR B)=0.74, and P(A AND B)=0.06, find P(B).
QUESTION 2
Which of the following results in the null hypothesis μ=38 and alternative hypothesis μ<38?
Correct answer: A fitness center claims that the mean amount of time that a person spends at the gym per visit is fewer than 38 minutes.
QUESTION 3
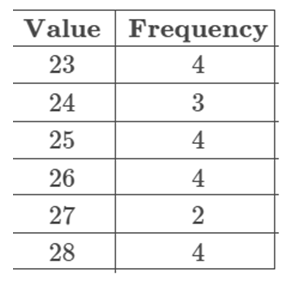
Given the following frequency table of values, is the mean or the median likely to be a better measure of the center of the data set?
A teacher claims that the proportion of students expected to pass an exam is greater than 80%. To test this claim, the teacher administers the test to 200 random students and determines that 151 students pass the exam.
The following is the setup for this hypothesis test:
{H0:p=0.80Ha:p>0.80
Find the test statistic for this hypothesis test for a proportion. Round your answer to 2 decimal places.
QUESTION 5
Given the following information about events A, B, and C, determine which pairs of events, if any, are independent and which pairs are mutually exclusive.
QUESTION 6
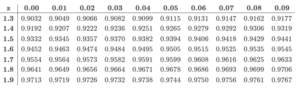
Find the area to the right of the z-score 1.40 and to the left of the z-score 1.58 under the standard normal curve.
QUESTION 7
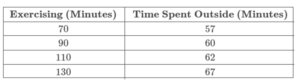
Karen is studying the relationship between the time spent exercising per day and the time spent outside per day and has collected the data shown in the table. The line of best fit for the data is y^=0.16x+45.5. Assume the line of best fit is significant and there is a strong linear relationship between the variables.
QUESTION 8
The number of square feet per house are normally distributed with a population standard deviation of 137 square feet and an unknown population mean. A random sample of 19 houses is taken and results in a sample mean of 1350 square feet.
Find the margin of error for a 80% confidence interval for the population mean.
| z0.10z0.10 | z0.05z0.05 | z0.025z0.025 | z0.01z0.01 | z0.005z0.005 |
| 1.282 | 1.645 | 1.960 | 2.326 | 2.576 |
You may use a calculator or the common z values above.
- Round the final answer to two decimal places.
QUESTION 9
Suppose the manager of a shoe store wants to determine the current percentage of customers who are males. How many customers should the manager survey in order to be 98% confident that the estimated (sample) proportion is within 8 percentage points of the true population proportion of customers who are males?
| z0.10 | z0.05 | z0.04 | z0.025 | z0.01 | z0.005 |
| 1.282 | 1.645 | 1.751 | 1.960 | 2.326 | 2.576 |
Use the table of values above.
QUESTION 10
Eric wants to estimate the percentage of elementary school children who have a social media account. He surveys 450 elementary school children and finds that 280 have a social media account.
Identify the values needed to calculate a confidence interval at the 99% confidence level. Then find the confidence interval.
| z0.10 | z0.05 | z0.025 | z0.01 | z0.005 |
| 1.282 | 1.645 | 1.960 | 2.326 | 2.576 |
Use the table of common z-scores above.
- Round the final answer to three decimal places.
QUESTION 11
Hugo is keeping track of the total amount of money he has saved over time. The line graph below shows the data.
A line graph titled Money Saved Over Time has a horizontal X-axis labeled Months from 0 to 7 in increments of 1 and a vertical Y-axis labeled Hundreds of Dollars from 0 to 16 in increments of 2. The graph consists of 8 plotted points connected by line segments from left to right. The coordinates of the plotted points are at left-parenthesis 0 comma 2 right-parenthesis, left-parenthesis 1 comma 5 right-parenthesis, left-parenthesis 2 comma 8 right-parenthesis, left-parenthesis 3 comma 10 right-parenthesis, left-parenthesis 4 comma 11 right-parenthesis, left-parenthesis 5 comma 12 right-parenthesis, left-parenthesis 6 comma 15 right-parenthesis, and left-parenthesis 7 comma 16 right-parenthesis.
How much, in hundreds of dollars, did Hugo save from month 0 to 4?
- Enter the answer as a whole number. For example, if Hugo saved 300dollars, enter 3 in the box below.
s
QUESTION 12
The finishing time for cyclists in a race are normally distributed with an unknown population mean and standard deviation. If a random sample of 25 cyclists is taken to estimate the mean finishing time, what t-score should be used to find a 98% confidence interval estimate for the population mean?
Use the portion of the table above or a calculator. If you use a calculator, round your answer to three decimal places.
QUESTION 13
Liam wants to estimate the percentage of people who lease a car. He surveys 240 individuals and finds that 54 lease a car.
Find the margin of error for the confidence interval for the population proportion with a 95% confidence level.
| z0.10 | z0.05 | z0.025 | z0.01 | z0.005 |
| 1.282 | 1.645 | 1.960 | 2.326 | 2.576 |
Use the table of common z-scores above.
- Round the final answer to three decimal places.
QUESTION 14
On average, Dakota has noticed that 18 trains pass by his house daily (24 hours) on the nearby train tracks. What is the probability that at most 4 trains will pass his house in a 11-hour time period? (Round your answer to three decimal places.)
QUESTION 15
Timothy wants to estimate the mean number of siblings for each student in his school. He records the number of siblings for each of 75 randomly selected students in the school. What is the statistic?
Correct answer: the mean number of siblings for the randomly selected students
QUESTION 16
If A and B are independent events with P(A)=0.7 and P(B)=0.3, find P(A AND B).
QUESTION 17
In which of the following situations can multiple regression be performed? Select all that apply.
QUESTION 18
The population standard deviation for the heights of dogs, in inches, in a city is 3.5 inches. If we want to be 92% confident that the sample mean is within 1 inch of the true population mean, what is the minimum sample size that can be taken?
| z0.10 | z0.05 | z0.04 | z0.025 | z0.01 | z0.005 |
| 1.282 | 1.645 | 1.751 | 1.960 | 2.326 | 2.576 |
Use the table above for the z-score, and be sure to round up to the nearest integer.
QUESTION 19
A college professor claims the proportion of students that complete a homework assignment is 70%. To test this claim, a random sample of students are monitored and checked if they completed the home the algebra class.
Assume that the test statistic for this hypothesis test is −1.73.
Since this is a two tailed hypothesis test, assume that the critical values for this hypothesis test are −1.96 and 1.96.
Come to a decision for the hypothesis test and interpret your results with respect to the original claim.
Correct answer: Fail to reject the null hypothesis.
There is not enough evidence to reject the claim that the proportion of students that complete a homework assignment is 70%
QUESTION 20
A softball pitcher has a 0.626 probability of throwing a strike for each curve ball pitch. If the softball pitcher throws 30 curve balls, what is the probability that no more than 16 of them are strikes?
- Round your answer to 3decimal places.
QUESTION 21
Find the linear regression line for the following table of values. You will need to use a calculator, spreadsheet, or statistical software.
Enter your answer in the form y=mx+b, with m and b both rounded to two decimal places.
| x | y |
| 3 | 6.03 |
| 4 | 9.65 |
| 5 | 11.49 |
| 6 | 11.57 |
| 7 | 12.96 |
| 8 | 14.97 |
| 9 | 16.31 |
| 10 | 17.43 |
| 11 | 18.55 |
QUESTION 22
The following dataset represents the number of registered students for 60 college courses, sorted and arranged in rows of 5. What is the 50th percentile of the data?
| 5 | 8 | 9 | 9 | 10 |
| 13 | 18 | 19 | 21 | 24 |
| 25 | 26 | 28 | 29 | 30 |
| 33 | 35 | 36 | 43 | 44 |
| 44 | 45 | 47 | 47 | 51 |
| 52 | 54 | 54 | 57 | 57 |
| 57 | 58 | 59 | 59 | 61 |
| 64 | 68 | 70 | 71 | 74 |
| 78 | 78 | 79 | 79 | 81 |
| 82 | 84 | 84 | 86 | 89 |
| 91 | 91 | 92 | 93 | 95 |
| 96 | 96 | 98 | 100 | 100 |
QUESTION 23
Tanya loves to walk in the park everyday after work. Given the frequency table below for a list of miles walked daily over the past few weeks, find the mean. (Please do not include the units in your answer.)
| Value | Frequency |
| 9 | 2 |
| 10 | 4 |
| 11 | 1 |
| 12 | 2 |
| 13 | 1 |
| 14 | 2 |
| 15 | 2 |
| 16 | 1 |
QUESTION 24
The answer choices below represent different hypothesis tests. Which of the choices are left-tailed tests? Select all correct answers.
QUESTION 25
Determine the critical value or values for a one-mean z-test at the 1% significance level if the hypothesis test is right-tailed (Ha:μ>μ0).
Solution:
QUESTION 1
If A and B are events with P(A)=0.2, P(A OR B)=0.74, and P(A AND B)=0.06, find P(B).
Correct answer: 0.6
QUESTION 2
Which of the following results in the null hypothesis μ=38 and alternative hypothesis μ<38?
Correct answer: A fitness center claims that the mean amount of time that a person spends at the gym per visit is fewer than 38 minutes.
…….Click link below to purchase full exam at $40