Question
The following dataset represents the math test scores for a class of 20 students.
90, 60, 85, 100, 100, 90, 100, 75, 100, 95, 95, 85, 30, 100, 40, 15, 100, 90, 70, 80
Identify the best measure of central tendency for this dataset.
Question
The following dataset represents the dollar amounts of donations collected at the entrance to a free museum during one hour.
| Donation Amount ($) | Frequency |
| 1 | 1 |
| 5 | 5 |
| 10 | 3 |
| 15 | 1 |
| 600 | 1 |
Is the median a reasonably good measure of central tendency for this dataset? What if the outlier were removed from consideration?
Question
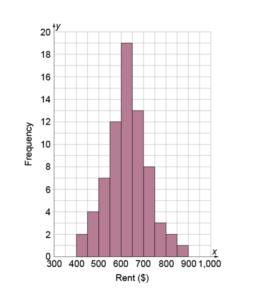
The following histogram shows the monthly rents reported in a survey of university students. Which of the following would be a reasonable measure of central tendency for this dataset? Select all that apply.
Question
The following histogram shows the dollar amounts of donations collected by a charitable organization over the course of a month. Identify the best measure of central tendency for this dataset.
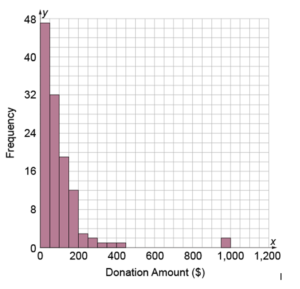
Solution:
Question
The following dataset represents the math test scores for a class of 20 students.
90, 60, 85, 100, 100, 90, 100, 75, 100, 95, 95, 85, 30, 100, 40, 15, 100, 90, 70, 80
Identify the best measure of central tendency for this dataset.
Correct answer median=90
…………………….Click link below to purchase full tutorial at $5